

Get stack
Let’s start with backtrace. Backtrace is an API provided by the system and is the fastest way to obtain the stack. However, the information obtained is limited. It can only obtain the return address of the function. Using the interface provided by libunwind, you can also obtain additional register information, but the performance Not comparable to backtrace. The code of backtrace is open source, and the principle is to trace back based on the fp register.
int backtrace(void**,int) __OSX_AVAILABLE_STARTING(__MAC_10_5, __IPHONE_2_0);
backtrace source code:
int backtrace(void** buffer, int size) {
	unsigned int num_frames;
	_thread_stack_pcs((vm_address_t*)buffer, size, &num_frames, 1, NULL);
	while (num_frames >= 1 && buffer[num_frames-1] == NULL) num_frames -= 1;
	return num_frames;
}
_thread_stack_pcs source code:
_thread_stack_pcs(vm_address_t *buffer, unsigned max, unsigned *nb,
		unsigned skip, void *startfp)
{
	void *frame, *next;
	pthread_t self = pthread_self();
	void *stacktop = pthread_get_stackaddr_np(self);
	void *stackbot = stacktop - pthread_get_stacksize_np(self);

	*nb = 0;

	/* make sure return address is never out of bounds */
	stacktop -= (FP_LINK_OFFSET + 1) * sizeof(void *);

	frame = __builtin_frame_address(0);
	if(!INSTACK(frame) || !ISALIGNED(frame))
		return;

  /***************** *****************/
	while ((startfp && startfp >= *(void **)frame) || skip--) {
		next = *(void **)frame;
		if(!INSTACK(next) || !ISALIGNED(next) || next <= frame)
			return;
		frame = next;
	}

  /***************** *****************/
	while (max--) {
		void *retaddr = (void *)*(vm_address_t *)
				(((void **)frame) + FP_LINK_OFFSET);
		buffer[*nb] = retaddr;
		(*nb)++;
		next = *(void **)frame;
		if(!INSTACK(next) || !ISALIGNED(next) || next <= frame)
			return;
		frame = next;
	}
}
Next, the implementation of _thread_stack_pcs is explained line by line.
first step:
Use pthread_get_stackaddr_np to get the starting address of the stack, and use pthread_get_stacksize_np to get the stack size. The stack space grows downward, so the stack range is [start address – stack size, start address).
	pthread_t self = pthread_self();
	void *stacktop = pthread_get_stackaddr_np(self);
	void *stackbot = stacktop - pthread_get_stacksize_np(self);
We need to use the stack interval to determine whether fp is within the valid range. The fp address + 1 stores lr, which is the return address of the function. To obtain the stack, we ultimately need to fetch lr. In order to ensure that the address of lr is stored (fp + 1) Within the valid range, the top address of the stack – 2 is required when judging fp.
	/* make sure return address is never out of bounds */
	stacktop -= (FP_LINK_OFFSET + 1) * sizeof(void *);
Step two:
Get the fp of the current function. __builtin_frame_address is a built-in function provided by GCC and some compatible compilers to obtain the address of the specified frame in the current function call stack. __builtin_frame_address(0) represents the fp of the current function, __builtin_frame_address(1) represents the fp of the caller, and so on. However, it is worth noting that this method is just a simple register value and does not determine whether fp is within the valid range. When the specified stack frame sequence exceeds the length of the current function stack, a crash may be triggered.
frame = __builtin_frame_address(0);
The compiler also provides another built-in function __builtin_return_address(0), which is used to obtain the return address lr of the specified stack frame function.
third step:
Enter the first while loop, which serves the backtrace_from_fp method. This method has one more starting fp parameter than backtrace.
API_AVAILABLE(macosx(10.14), ios(12.0), tvos(12.0), watchos(5.0))
OS_EXPORT
int backtrace_from_fp(void *startfp, void **array, int size);
backtrace_from_fp is used to skip some functions on the top of the stack, which may be meaningless or fixed. This loop will recursively take the pointer stored in fp and first find startfp.
next = *(void **)frame;
The fp address + 1 stores lr, and fp itself stores the fp of the last called function. Suppose there are three functions A, B, and C. Function A calls B, and B calls C. Take fp in the C function, fp + 1 means that lr points to function B, take the address value *(void **)fp stored in fp, which is the fp of the B method. By analogy, you can get the complete call chain A -> B -> C. In fact, fp stores not only lr but also some parameters and local variables. However, to obtain the specific meaning of fp + x at runtime, you need to rely on the dwarf file, and the online package does not contain the dwarf file, so it is usually done online Analysis below.
the fourth step:
The second while loop, the core logic of fp backtracking, has the previous foreshadowing, so it should be relatively simple to understand here. To get the value of frame, recursively obtain the fp of the previous layer function, obtain the function return address for fp + 1, and finally save the return address into the array.
Stack analysis
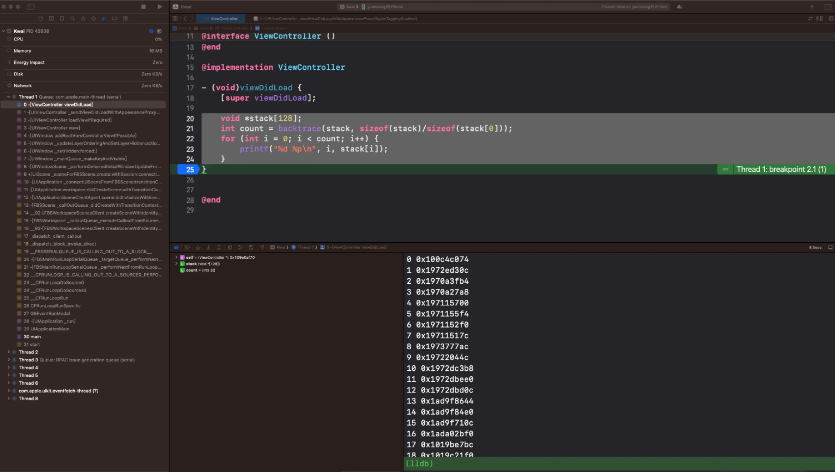
Take the following code as an example to take the viewDidLoad method call stack.
- (void)viewDidLoad {
    [super viewDidLoad];
    void *stack[128];
    int count = backtrace(stack, sizeof(stack)/sizeof(stack[0]));
    for (int i = 0; i < count; i++) {
        printf("%d %p\n", i, stack[i]);
    }
}
What is stored in the stack are addresses. How to convert these addresses into function names is what we discuss in this section.
Many iOS development students have come into contact with bugly. Bugly symbol analysis relies on the dsym file we uploaded. dsym contains a dwarf file, which stores the mapping relationship between addresses and symbols. Of course, there are also other debug information, about the dwarf format. For introduction, you can refer to the official documentation, so I won’t elaborate too much here.
The address stored in dwarf is actually the offset relative to the starting address of the executable file. The virtual address is stored in the stack. Converting the virtual address to the offset in the dwarf requires two key pieces of information: the dylib where the virtual address is located and the loading address of the dylib. In addition, we need the unique identifier uuid of dylib, which is used to associate specific dwarf files offline. The following is a rough process:
first step:
Get all dylib loading addresses and corresponding uuid. The system provides some APIs to easily obtain this information. The header address obtained using the _dyld_get_image_header interface is also the loading address of dylib.
    uint32_t image_count = _dyld_image_count();
    for (int index = 0; index < image_count; index++) {
        const struct mach_header_64* header
        = (struct mach_header_64 *)_dyld_get_image_header(index);
        const char *name =
        _dyld_get_image_name(index);
        struct uuid_command* uuidCmd = nullptr;

        uintptr_t cmdPtr = (uintptr_t)(header + 1);
        for (uint32_t index = 0; index < header->ncmds; index++) {
            struct load_command* command = (struct load_command*)cmdPtr;
            if (command->cmd == LC_UUID) {
                uuidCmd = (struct uuid_command*)cmdPtr;
                break;
            }
            cmdPtr += command->cmdsize;
        }

        ImageInfo *info = new ImageInfo(name,
                                        (uint64_t)static_cast<const void *>(header),
                                        uuidCmd->uuid);
        _images.push_back(info);
    }
Step two:
Binary search for the dylib where the pc in the stack is located.
   auto imagesIt = std::lower_bound(_images.begin(),
                                 _images.end(),
                                 pc, [](ImageInfo *first, uintptr_t second){
          bool rv = first > (second);
          return rv;
    });
pc – The loading address of dylib = offset within dwarf. How to do offline symbol analysis after obtaining offset and uuid? Let’s still take the viewDidLoad method as an example.
viewDidLoad is in the main executable file Kwai, the corresponding load address is 0x0000000104cc8000, and the uuid is AC58D77F-5F09-35EF-AF14-A1F163D38F99.
[ 0] AC58D77F-5F09-35EF-AF14-A1F163D38F99 0x0000000104cc8000 /Users/yuencong/Library/Developer/Xcode/DerivedData/Kwai-fadabaveapyesuaqiyqeywfcssxe/Build/Products/Debug-iphoneos/Kwai.app/Kwai
The return address corresponding to viewDidLoad is 0x104ccc074, and the calculated offset = 0x0000000000004074
The dwarf file corresponding to Kwai obtains the uuid. This uuid is consistent with the one obtained at runtime:
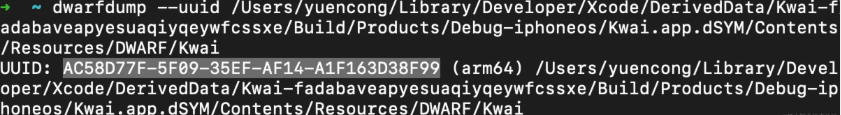
Use dwarf to parse symbols:
➜ ~ dwarfdump --arch arm64 "/Users/yuencong/Library/Developer/Xcode/DerivedData/Kwai-fadabaveapyesuaqiyqeywfcssxe/Build/Products/Debug-iphoneos/Kwai.app.dSYM/Contents/Resources/DWARF/Kwai" --lookup="0x0000000100004073"
Output results, relying on the dwarf file we can not only get the function name, but also the specific file and line number.
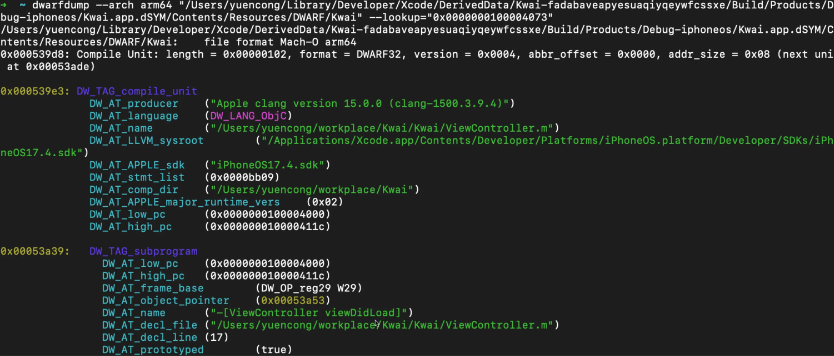
The address we look for when using the dwarf instruction is 0x0000000100004073 = 0x4074 – 1 + 0x0000000100000000.
-1: backtrace obtains the return address. -1 is to obtain the pc when the previous function executed a jump. -1 is not an exact value, but it is enough for symbol analysis.
0x0000000100000000: The vmaddr and debug packages of dwarf are usually fixed values and can also be obtained through the otool tool.
otool -l "dwarf_path" | grep __TEXT -m 2 -A 1 | grep vmaddr
Summarize
The above is just a general process of obtaining the stack and symbolizing it. In the real practice process, you usually do some subtraction for stack acquisition and implement the fp backtracking yourself. Offline symbol parsing does not rely on the original dwarf file. The dwarf file is usually parsed into a mapping relationship between offset and function information. Symbolization can be achieved with only one table lookup during parsing.
In the entire link, parsing dwarf into mapping of offset and function information is the difficulty and core. Kuaishou’s dwarf parsing tool has been running efficiently online for more than a year, and the time required to process a dwarf file exceeding 1 G can be controlled within seconds. Within the level, it also supports inline expansion and swift demangle. If you are interested in this content, please stay tuned for subsequent blog updates.